Today most of the applications are multithreaded. Parallelism improves performance of applications. But there can be scalability bottlenecks inside the kernel. There are studies that exposes such bottlenecks in linux kernel. Even if the application is written in a perfectly scalable fasion, sometimes the bottlenecks inside the kernel prevent the application from scaling to a large number of processors. There are two main reasons for this problem
- Sometimes some operation inside the kernel is serialized, and a lock contention happens in some part of the kernel.
- There can be some unforeseen situation, which causes lock contentions
In both the cases it is important to figure out which part of the kernel is causing the scalability issue.
There are different tracing tools in linux which help collecting details of running kernel and users can run from the userspace. But there is no tool which gives a comprehensive analysis of different types of locks inside the kernel. Our aim is to come up with a tool, which can monitor all kinds of locks used in the linux kernel, on all the subsystems.
With the introduction of eBPF(Extended Berkeley Packet Filter) to the linux kernel, it has become possible to write tracing tools for linux easier than before. There are different tracing frameworks based on eBPF like bpftrace and bcc. These tools allows users to insert dynamic probes in the kernel and execute some code which can do tracing. Different tools are developed and distributed along with above tracing frameworks. But there is no tool which can measure lock contentions in the kernel.
Table of Contents
Background
eBPF
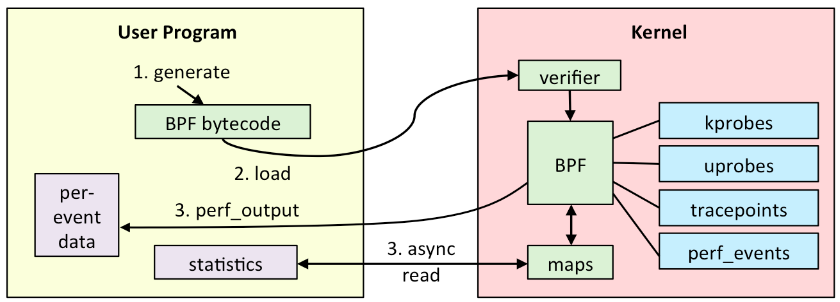
eBPF, which was introduced from linux kernel 3.18, has brought DTrace like features to the kernel. eBPF is an in kernel virtual machine in linux kernel which can run user supplied code. Before eBPF, BPF(Berkeley Packet Filter) was present in the linux kernel. BPF was used by pcap library used by tcpdump to run code for filtering network packets. The design and instruction set of BPF was left behind as modern processors evolved . Thus BPF was extended as eBPF, which is more capable and has many performance improvements. The linux kernel has to be compiled with CONFIG_BPF_SYSCALL option and kernel version should be atleast 4.4. Most modern distributions like ubuntu includes kernel compiled with CONFIG_BPF_SYSCALL option.
 Overview of eBPF
eBPF can run programs which can be attached to certain code paths in kernel and it can access kernel data structures. This makes it a perfect candidate for tracing applications. eBPF programs are safe. Any issue in the eBPF program will not crash the machine in any case.
eBPF statically checks the program before executing. The code running inside eBPF virtual machine can not break the kernel. eBPF programs are loaded to kernel using the bpf() system call. BCC(BPF Compiler Collection) is an LLVM based compiler for converting C like programs to eBPF instructions. BCC, which supports multiple languages like Python, Lua etc., is usefull for writing complex tracing programs. There are various tools already available in BCC toolkit to inspect different aspects of the kernel. Presently there is no tool available in the BCC toolkit to get information about lock contentions in the kernel.
BCC
BCC is a toolkit to insert eBPF programs into kernel and collect information from them. BCC has a python front end. It uses an LLVM backend to compile eBPF programs written in C language to eBPF byte code. BCC can then insert this code to eBPF. The data in the eBPF programs can be directly read data to the python script, via perf buffers. The collected data can be easily processed and displayed easily using pythons rich data processing abilities.
kLockStat Design
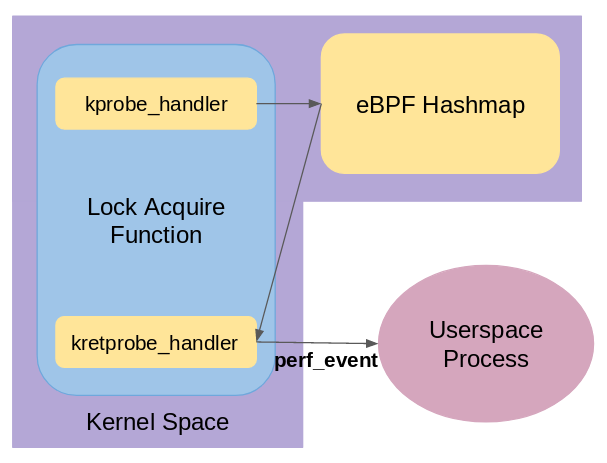
The kLockStat tool has to collect information needed to identify lock contentions from the kernel. For this, the running kernel is instrumented to run code inside eBPF at the beginning (kprobe_handler) and at the end (kretprobe_handler) of all the lock acquire function calls, as shown in Figure 2. The handlers store their data in the internal eBPF Hashmap datastructure. Since the eBPF code is runs for all the lock operations inside the kernel for a particular type of lock, we need to keep its footprint as small as possible. Towards this, the work is split between the Instrumentation code running in eBPF, and the User Space Process running as a python script. eBPF code does a minimal job of collecting the required information and pushes it to the python script running in the user space. Processing this information and creating the report is the job of the python script.

Design of kLockStat
Instrumentation
Different types of locks are present in the kernel. The instrumentation code should be should be common for all the locks, so that same code can be used to monitor all kinds of locks in the kernel. We are more interested in collecting the time each thread is waiting on locks. Developers will need more information to get a clear picture of where the contention is happening in the kernel and why this lock is being contented and how much time is wasted on this lock. To get a clear picture, following information is collected on each lock acquire function calls.
- pid of the thread
- tid of the thread
- time-stamp of the lock function call
- thread name
- lock address
- number of times the lock function is called
- type of the lock
A hash table is used to save the collected details. It is clear that the best candidate for the key to be used in the hash table is lock address and the thread id. Lock address is a unique identifier for all locks in the kernel address space. The same lock can be acquired by many threads at the same time. Thus lock address + Thread id can uniquely identify a lock acquire event in the kernel.
To measure the locking time, a probe is executed just before returning from the lock acquire function. At this point, the time-stamp is measured and the time-stamp that was recorded initially when the lock acquire call is subtracted from the present time stamp. Also the stack trace is stored at this point. After collecting the details, the collected data is pushed to user space.
User Space Process
A user space process polls the perf event buffer to read the data from the ePBF process. The used process revieces an object which has information of one particular lock acquire funtion calls. The details the user process gets includes the address of the lock, tid, pid of the locking thread, waiting time, the stack trace of the lock acquire function call. Using this information, it creates and updates a table which contains the information of all the locks that it is tracking. For each lock, it keeps a cumuative locking time, and the number of times the lock is acquired. It stores the stack traces from which the lock is acquire along with the locking time for each stack trace. This helps to identifies which function spending more time waiting for the lock.
Implementation
kLockStat is implemented using the BPF Compiler Collection, which allows to insert probes and eBPF code from a python script. The same python script after inserting the probes constatnly polls the perf event buffer to collect data from eBPF scripts running in the kernel. kLockStat} by default tracks all lock events for read lock, write lock and mutexes inside the kernel. kLockStat} can monitor any other types of locks by simply extending a json input file.
Data Structures
eBPF provides a number of data structures that helps the code running in the virtual machine to save information and to communicate with user level processes.
Struct for processing each locking operations
struct data_t {
    u32 pid;
    u32 tid;
    u64 ts;
    char comm[TASK_COMM_LEN];
    u64 lock;
    u64 lock_time;
    u64 stack_id;
    u32 type;
};
The code running inside the eBPF virtual machine uses the above struct to save the information it collects from each lock activities.
Hash Map for saving the records
eBPF provides hashmaps, which helps to store informations between two different probe events. We are using separate hash maps for different types of locks. The value stored in the hashmap are the objects of the struct described above. The key used is a combination of the address of the lock and the tid, pid combination of the thread which is trying to acquire the lock.
struct key_t {
    u64 pid;
    raw_spinlock_t* lock;
};
The above struct represents a key. It uniquely identifies a particular locking event in the kernel. The value is the data presented above.
Stack Records
eBPF provides the stacktrace data scructure to store stack traces. For each lock acquire call, we store the stack record of that call in such a data structure. This will helps to process information like which function is trying to acquire the lock and which code path is creating contention.
Perf Ring Buffer
When a lock acquire function has completed execution, the time taken for that operation can be sent to the user space process for processing. eBPF provides support for perf ring buffers. Using perf ring buffers, we can stream this data to the user space.
Instrumentation Details
kprobe_handler()
A general template of the instrumentation function to be put on all the lock acquire function is designed to be run in eBPF.
int kprobe_handler(struct pt_regs *ctx,
					 void *lock)
{

  u32 current_pid = bpf_get_current_pid_tgid();
  if(current_pid == CUR_PID)
    return 0;

  struct data_t data = {};
  struct key_t key =
     {bpf_get_current_pid_tgid(), lock};
  data.pid = bpf_get_current_pid_tgid();
  data.tid = bpf_get_current_pid_tgid() >> 32;
  data.ts = bpf_ktime_get_ns();
  bpf_get_current_comm(&data.comm,
          sizeof(data.comm));
  data.lock = (u64)lock;
  data.stack_id = stack_traces.get_stackid
     (ctx, BPF_F_REUSE_STACKID);
  map.insert(&key, &data);
  return 0;
}
A probe is inserted on the lock acquire funtions using kprobe so that whenever a lock acquire funtion is called in the kernel, the above code will be executed inside the eBPF virtual machine. The above function has access to the context of the lock acquire function which allows it to collect the required information.
When a lock acquire function is called in the kernel the above code gets executed. The above function will get the context of the function call and the actual argument of the function. It maintains a hash-map which stores record of each for each lock function calls.
- It uses the lock address and the tid of the thread as a key to see if there is already a record for this lock
- It then creates an object and stores the necessary information like present time, tid, tgid, thread name, and lock’s address in the kernel address space.
- It then pushes this newly created object to the hash-map so that it can be accessed when the lock is acquired.
kretprobe_handler()
When the lock function is exiting, the wait for acquiring the lock has ended and now we can calculate the time it has taken waiting for the lock. For this we insert the following code to be executed just before exiting from the lock acquire function.
int kretprobe_handler(struct pt_regs *ctx,
				 raw_spinlock_t *lock) {
  u64 present = bpf_ktime_get_ns();
  u32 current_pid = bpf_get_current_pid_tgid();
  if(current_pid == CUR_PID)
    return 0;

  struct data_t *data;
  struct key_t key =
    {bpf_get_current_pid_tgid(), lock};
  data = map__NAME_.lookup(&key);
  if(data)
  {
    data->lock_time += (present - data->ts);
    data->type = _ID_;
    perf_buffer.perf_submit(ctx, data,
       sizeof(struct data_t));
  }
  return 0;
}
This function accesses the previously saved object using the lock address and thread id as a key in the hash-map. The object will have the time at which the thread started waiting for this lock. That time is subtracted from the present time to get the wait time in nanoseconds. This function also records the stack trace of the lock function call in the object. The object is then pushed into the perf event buffer, so that the user level python script can access and process it accordingly.
Considering the locking overhead
As we are inserting code in the lock acquire funtion, this will increase the running time of the function. Thus the wait time we collect, will have the time required to run the tracing code. We can assume that there should be lock that are not contented or there are locks which is acquired as soon as the lock acquire funtion is called in the kernel. The minimum locking time is found out and this value is subtracted from all the lock waiting time. This ensures to an extend that tracing time is not included as the lock waiting time in our measurement.
Report Generation
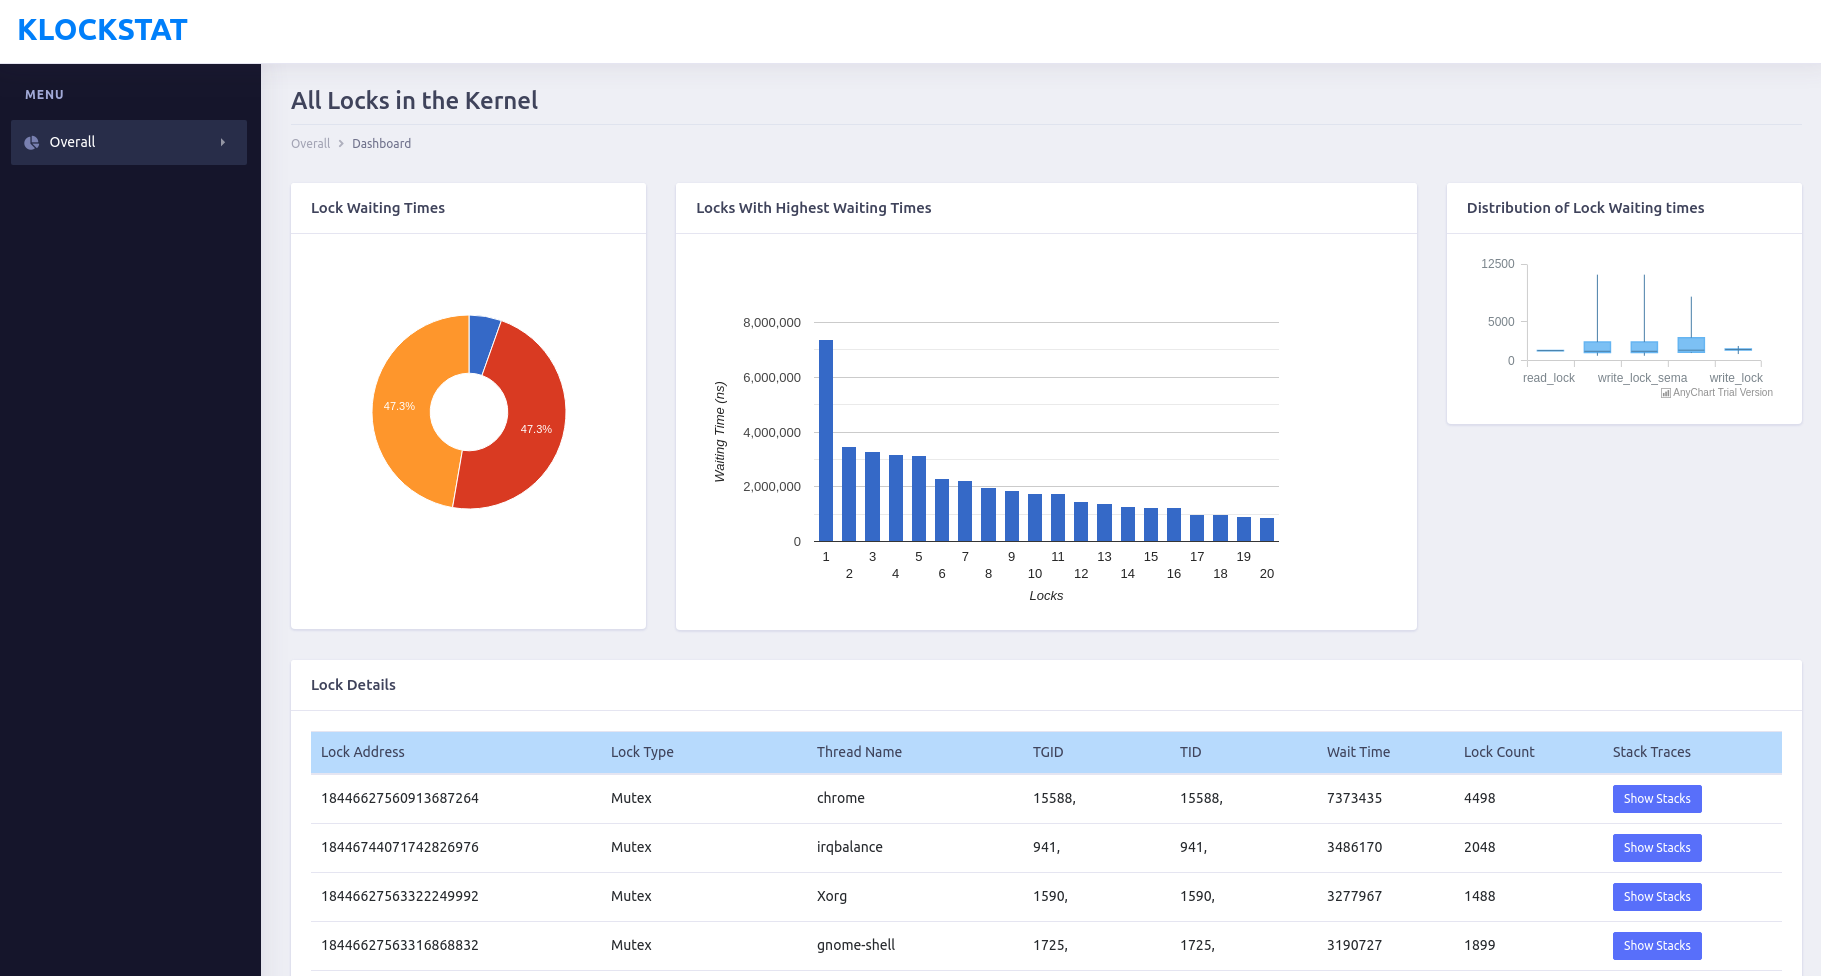
 Screenshot of a report generated by kLockStat
kLockStat creates html reports as shown above. The python library Jinja is used to create the html report. Google charts Javascript API is used to plot charts in the report. The html report contains the following charts, that will enable a programmer to quickly spot anomalies in the kernel lock contentions -
- Doughnut Chart - share of locking times for each type of lock.
- Histogram - a bar chart of waiting time for all locks in the kernel.
- Box Chart - spread of locking times of each type of lock
The report also generates a table of all locks, sorted in the order of locking time, that helps to identify the cause of contentions. The details presented in the table are -
- Lock Address
- Lock Type
- Thread Name
- PID
- TID
- Total Wait Time
- Total Count
- Stack Trace
Github repository for this tool: https://github.com/prathyushpv/lockstat
