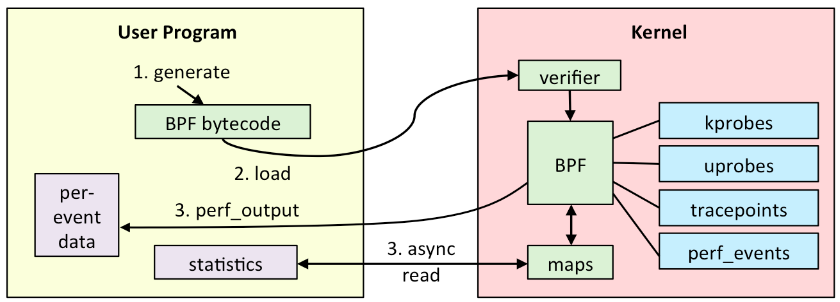
eBPF is an in kernel virtual machine in linux. It can execute user supplied code in a sandboxed environment inside the kernel. It can be used in different ways to achieve different goals. Most usefull and interesting application of eBPF is dynamic tracing.
eBPF
eBPF, which was introduced from linux kernel 3.18, has brought DTrace like features to the kernel. eBPF is an in kernel virtual machine in linux kernel which can run user supplied code. Before eBPF, BPF(Berkeley Packet Filter) was present in the linux kernel. BPF was used by pcap library used by tcpdump to run code for filtering network packets. The design and instruction set of BPF was left behind as modern processors evolved . Thus BPF was extended as eBPF, which is more capable and has many performance improvements. The linux kernel has to be compiled with CONFIG_BPF_SYSCALL option and kernel version should be atleast 4.4. Most modern distributions like ubuntu includes kernel compiled with CONFIG_BPF_SYSCALL option.
 Overview of eBPF
eBPF can run programs which can be attached to certain code paths in kernel and it can access kernel data structures. This makes it a perfect candidate for tracing applications. eBPF programs are safe. Any issue in the eBPF program will not crash the machine in any case.
eBPF statically checks the program before executing. The code running inside eBPF virtual machine can not break the kernel. eBPF programs are loaded to kernel using the bpf() system call. BCC(BPF Compiler Collection) is an LLVM based compiler for converting C like programs to eBPF instructions. BCC, which supports multiple languages like Python, Lua etc., is usefull for writing complex tracing programs. There are various tools already available in BCC toolkit to inspect different aspects of the kernel. Presently there is no tool available in the BCC toolkit to get information about lock contentions in the kernel.
Dynamic Tracing
Inserting code in a running software dynamically and getting out information about the executing is reffered to as dynamic tracing. Dynamic tracing is very usefull for troubleshooting, debugging and performance tracing. The most famous dynamic tracing tool is DTrace. DTrace is originally developed by SUN Microsystems for the Solaris Operating system. There was no good tracing tool is linux for a long time. eBPF finally has filled this gap.
If you are interested in understanding how things work inside the kernel, or if you want to figure out performance issues or bottlenecks in the linux kernel, you should learn to use eBPF.
Setting up bcc
bcc(BPF Compiler Collection) is a toolkit for creating tracing tools using eBPF. eBPF is a vm and it has its own instruction set. Writing code directly in it is as difficult as writing assembly code. bcc has a clang backend which will convert c code into eBPF code. With bcc you can write tracing tools in python or lua. This makes it possible for anyone to write tools that leverage the features of eBPF. You can install stable bcc binaries using the following commands (ref: bcc/INSTALL.md at master · iovisor/bcc · GitHub).
sudo apt-key adv --keyserver keyserver.ubuntu.com --recv-keys 4052245BD4284CDD
echo "deb https://repo.iovisor.org/apt/$(lsb_release -cs) $(lsb_release -cs) main" | sudo tee /etc/apt/sources.list.d/iovisor.list
sudo apt-get update
sudo apt-get install bcc-tools libbcc-examples linux-headers-$(uname -r)
Once the packages are installed, you can try out some tools written in bcc. For example you can run the tool execsnoop by using the command,
sudo /usr/share/bcc/tools/execsnoop
The execsnoop will attatch a probe on the system call execve and it will print the command passed to execute in the terminal. You can open some application and check the terminal to see execsnoop in action. execsnoop should print the name of the application you just opened.
Scripting in bcc
We can write python scripts using the bcc python library that can insert probes in kernel functions and execute an attached code.
from bcc import BPF
BPF(text='''
int kprobe__sys_clone(void *ctx) {
  bpf_trace_printk("Hello, World!\\n");
  return 0;
}''').trace_print()
You can save it into a file and run it with sudo. We have to import the BPF class and create and object for it. We are passing an argument text to the constructor, which contains a c function. The function starts with kprobe__ which implies that a kprobe will be inserted at sys_clone function in the kernel, and the function body will be executed whenever this function is called in the kernel.
The body of the function contains only one function call bpf_trace_printk which will simply print the string argument passed into it.
Finally we will call the trace_print member function of the BPF class which will print the contents into the terminal.
You can read the tutorial bcc/tutorial_bcc_python_developer.md at master · iovisor/bcc · GitHub to learn more about the library.
